Executive Summary
This guide explains how to evaluate the number of activities on a kids learning laptop and recommends activity counts by age, use case, and deployment model. Activity count is not a vanity metric — it is a proxy for content breadth, variety, and long‑term engagement potential. But raw counts alone do not determine educational value. Buyers must balance activity quantity with activity depth (levels, adaptivity), content alignment to learning standards, hardware durability, software update policy, and total cost of ownership (TCO).
Key conclusions:
– For preschool (ages 2–4) a device with 20–60 well-designed activities is sufficient if activities include repeated level progression and multi-sensory interaction.
– For kindergarten to Grade 2 (ages 5–7) target 50–150 activities, with explicit literacy and numeracy scaffolding across progressive levels.
– For Grades 3–5 (ages 8–10) target 150–400 activities or support for downloadable app ecosystems and curricular content updates.
– Devices sold with static preloaded activities require higher initial counts (100+) to avoid rapid obsolescence. Devices that support downloadable content and subscriptions can start with lower preloaded counts (30–80) because content can be refreshed.
– For institutional buyers (preschool chains, school districts), expect a 3‑year TCO that includes hardware replacement (10–30% annual attrition), per‑seat content licensing ($10–$60 per seat per year depending on content), and support — budget 20–50% above unit sticker price over three years.
This guide provides the decision framework, hardware and software specifications to evaluate, pricing examples, procurement steps, compliance checklist (CPSIA, ASTM, EN71, RoHS, FCC, IEC 62133), and a sample pilot/evaluation plan for B2B buyers.
What Is Kids Learning Laptop Activity Count and Who Uses It
Definition
– Activity count = the number of distinct, user‑addressable learning activities or applications a device ships with or immediately provides through its native software environment. It excludes duplicated levels or slightly varied skins if they do not change learning outcomes.
– Activity types include games, lessons, quizzes, creative tools (drawing, music), coding blocks, simulated toys (calculator, keyboard practice), and assessment modules.
– Two component counts buyers must track: preloaded activity count and downloadable/accessible activity ecosystem (marketplace apps, cloud content).
Who uses activity count as a procurement metric
– Early‑childhood centers and private preschools: choose devices to match attention spans and curriculum requirements.
– K–5 school districts: prioritize aligned standards, progress reporting, and scalability.
– Retail buyers and distributors: use activity count as a retail feature but weigh brand recognition and price elasticity.
– OEM/ODM procurement managers: negotiate activity bundles, licensing, update cadence, and localization.
– Home‑use buyers (parents): use activity count as a proxy for perceived value, but often focus on favorites (letters, numbers, phonic games).
Why buyers measure activity count
– Perceived engagement: more distinct activities can imply longer usable life.
– Curriculum coverage: buyers want assurance that core domains (literacy, numeracy, motor, socio-emotional) are covered.
– Differentiation: for retail products, activity count is a marketing differentiator; for institutional procurement, it’s one of several evaluation metrics.
Why Demand Is Growing
Market drivers
– Increased emphasis on early learning readiness and measurable outcomes for preschool and K–5 populations drives demand for interactive devices and structured activity sets.
– Blended learning models: devices that support both in-class screening and at-home practice are in demand.
– Subscription content economics: vendors offer continuous content updates, which changes buyer expectations from a single purchase to ongoing content relationships.
– Parental demand for screen time that is “educational” — B2B buyers in retail and distribution respond to consumer preference for devices that list curricular capabilities and activity counts.
Pedagogical drivers
– Research and practice emphasize repeated, spaced practice, and scaffolding — features best implemented by multiple activities with level progression and assessment.
– Early exposure to coding and logic exercises makes devices with varied activity types (puzzles, sequence tasks, drag/drop coding) attractive.
Operational drivers
– Institutional buyers expect device fleets to be robust and content to be measurable (progress tracking, reports).
– Cost containment: devices that require fewer teacher interventions and have content that adapts to the learner reduce long‑term staff costs.
Quantitative indicators (industry norms)
– Typical toy laptops: 10–80 preloaded activities.
– Mid-tier kids tablets: 30–200 activities + app ecosystem.
– Rugged Chromebooks / tablets for schools: initial activity sets lower, but access to thousands of apps via managed stores and LMS integrations.
Key Technology Differences
Device categories and how they affect activity count
– Toy-style learning laptops (closed systems): fixed, preloaded activity sets (10–80). Pros: controlled content, no internet exposure; Cons: limited scaling, short effective shelf life unless large activity count.
– Android-based kids tablets (w/ keyboard shell): moderate preloaded set (30–200) plus Play‑store/curated app store access when permitted. Pros: flexible content expansion; Cons: require management to enforce age-appropriate content.
– Rugged Chromebooks / Windows hybrids: often shipped with fewer preloaded activities but access to full web apps and LMS integrations; activity count dependent on third‑party apps and licensing.
– Subscription/cloud-native platforms: base device activity count can be small if the device offers streaming/online content; requires reliable connectivity and subscription budget.
Hardware implications
– CPU and RAM: activity complexity (animations, voice recognition, simple AI adaptivity) requires at least a quad‑core ARM Cortex‑A53 / A55 class processor with 1–2 GB RAM for smooth operation. Very basic toy laptops can run on single/dual‑core low‑power microcontrollers with <512 MB RAM.
– Storage: basic devices can operate with 4–8 GB flash if activities are lightweight. For multimedia-rich content (video, audio), target 16–64 GB local storage or microSD expansion.
– Display: 6–10 inch IPS panels recommended for text clarity; minimum resolution 800×480; 1280×800 preferred for older children.
– Battery: capacities should support 6–12 hours of mixed use for tablets; toy laptops often have AAA batteries or small Li‑ion packs lasting 8–20 hours depending on workload.
– Connectivity: Wi‑Fi 802.11n is minimum for content updates; 802.11ac preferred. Bluetooth for peripherals is optional.
– Durability: look for drop ratings (1m), reinforced hinges for keyboards, sealed battery compartments, and washable surface materials.
Software and ecosystem differences
– Static content vs adaptive platforms: static content relies on initial activity count; adaptive platforms use fewer activities but provide progression and individualized practice.
– LMS/API integrations: essential for school deployments; teacher dashboards and reporting are differentiators.
– Content licensing: OEMs may bundle proprietary content or include third‑party licensed libraries; licensing terms affect per‑seat cost and update capability.
Security and data considerations
– COPPA, GDPR‑K: devices that collect personal data must comply with child data regulations.
– Firmware update channels: over‑the‑air (OTA) update ability is necessary to patch content and security issues; verify update frequency and vendor SLAs.
Key Features and Specifications to Evaluate
Activity-related specifications
– Preloaded activity count (explicit number): ask vendors for a precise list (titles, objectives, age alignment) and sample playthrough videos.
– Activity depth: number of levels, difficulty bands, scoring mechanics, adaptive algorithms. Example: a counting activity with 6 levels and progressive complexity counts as 1 activity with depth = 6.
– Activity types (minimum checklist): alphabet/phonics, basic math (counting, addition/subtraction), shape/colour recognition, puzzles, fine motor/music, coding/logical sequencing, vocabulary/language, socio-emotional scenarios.
– Assessment tools: embedded quizzes, mastery thresholds, time-on-task metrics, auto‑graded items.
– Multi-user support: number of profiles supported locally and in cloud (important for classrooms).
Content and pedagogical alignment
– Standards alignment: Common Core, UK EYFS, Australian Early Years — request mapping documents.
– Localization: language packs, cultural relevance, voiceover quality.
– Update policy: frequency of new activities, security patches, content retirement policy.
Hardware features
– Processor: minimum quad‑core ARM 1.2–1.6 GHz for fluid interface; high‑end 2.0 GHz+ for advanced content.
– RAM: toy devices 256–512 MB; entry tablets 1–2 GB; institutional tablets 4 GB+.
– Storage: minimum 8 GB internal (4 GB usable); 16 GB recommended for multimedia apps; microSD slot recommended up to 256 GB.
– Screen: 7–10 inches; 800×480 minimum; IPS recommended for viewing angles.
– Battery: 4,000 mAh+ for tablets to hit 8–12 hours; for replaceable battery units, check cycle life 300+ full cycles for Li‑ion.
– Charging: USB‑C preferred; proprietary chargers increase logistics complexity.
– Physical durability: drop test rating, sealed buttons, water resistance claims (note: few devices have certified IP ratings).
– Spare parts: availability (keyboards, screens, batteries) and lead times.
Management and support
– Device management (MDM): remote app push, content blocking, device provisioning.
– Reporting: daily/weekly activity logs, exportable CSV, teacher dashboards.
– Warranty and RMA terms: typical warranty 12–24 months; extended options, on‑site support for institutional buyers.
Procurement KPIs
– Minimum order quantity (MOQ) for custom bundles/branding.
– Lead time: typical manufacturing lead times 60–120 days for MOQ orders.
– Sample policy: cost for functional sample vs engineering sample.
Pros and Cons
Low activity count devices (10–50)
– Pros: lower upfront cost (toy laptops $15–$40), simpler UI for toddlers, controlled environment reduces accidental exposure.
– Cons: rapid content fatigue, limited curriculum coverage, replacement or out-of-box obsolescence within 6–12 months if used daily.
Medium activity count devices (50–200)
– Pros: balance between cost and longevity; supports progression and multiple domains; appropriate for K–2.
– Cons: may still require content refresh or subscriptions for Grade 3+ children.
High activity count devices and platforms (200+ or subscription ecosystems)
– Pros: longer shelf life, scalable to multiple grade levels, better for institutional deployment and shared fleets.
– Cons: higher license/subscription costs; requires MDM and management; more complex onboarding for classroom teachers.
Static preloaded content vs downloadable/subscription
– Static content pros: predictable costs, offline availability, reduced data/privacy concerns.
– Static content cons: no content refresh, limited adaptability.
– Subscription content pros: continuous updates, adaptive learning pathways, analytics.
– Subscription content cons: recurring costs, dependency on vendor stability and internet access.
Hardware tradeoffs
– Rugged devices cost more up front but reduce replacement frequency (lower TCO in institutional environments).
– Cheap devices reduce initial capex but increase replacement and support costs.
Step-by-Step Decision Guide
Step 1 — Define learning outcomes and user profile
– Age range, class size, teacher ratio, daily device usage (minutes per child), device sharing model (1:1 or shared).
– Example objective: improve phonemic awareness for 5-year-olds with 20 minutes/day per child.
Step 2 — Determine activity composition and count targets
– Preschool (2–4): 20–60 activities; focus: sensory, motor, simple language, repetition with levels.
– K–2 (5–7): 50–150 activities; focus: phonics, early numeracy, sequencing, assessment.
– Grades 3–5 (8–10): 150–400 activities or access to expandable app ecosystems; focus: fluency, problem solving, basic coding.
Step 3 — Decide content model
– Static (no internet): requires higher preloaded count and offline assessment capabilities.
– Managed online content: allows lower preloaded count but requires MDM and subscription budget.
Step 4 — Set hardware minimums
– For 3+ year institutional lifecycle: quad‑core CPU, 2–4 GB RAM, 16 GB storage, IPS display, USB‑C charging, 8–12 hour battery life, reinforced chassis, replaceable parts or service plan.
Step 5 — Evaluate vendors and samples
– Request full activity list, mapping to standards, sample devices with sample user accounts, and teacher dashboard walkthroughs.
– Test content for appropriateness, progression, and retention with a small pilot (10–30 learners) for 2–6 weeks.
Step 6 — Pilot evaluation metrics
– Engagement: average time on task per session (target 10–20 minutes for K–2).
– Mastery: percent of learners achieving mastery on a targeted skill after X exposures (target 60–80% after 8–12 repetitions).
– Reliability: mean time between failures, battery hold, charging times.
– Teacher burden: time to set up, monitor, and interpret reports (target <10 minutes per class session).
Step 7 — Procurement terms and licensing
– Negotiate price per unit, volume discounts, content licensing (perpetual vs subscription), SLA for updates and security patches, and support terms.
Step 8 — Deployment plan
– MDM rollout, teacher training (2–4 hours), onboarding parent consent if required, inventory and warranty tracking.
Step 9 — Ongoing measurement and renewal
– Quarterly reviews on engagement, replacement rates, and content satisfaction. Plan for content refresh cycles and hardware refresh at year 3.
Step 10 — Scale or pivot
– If pilot metrics meet targets (engagement, mastery, teacher time), scale procurement with attention to supply chain lead times and spares.
Pricing and Cost Analysis
Unit price ranges (indicative)
– Basic toy learning laptops (static content, retail): $15–$45/unit.
– Consumer kids tablets (with keyboard shell, limited MDM): $70–$200/unit.
– Rugged education tablets/Chromebooks (school grade): $180–$450/unit.
– Enterprise devices (custom firmware, ruggedized): $350–$700/unit depending on features and bulk.
Content and licensing
– Consumer subscription (app store content): $2–$10/month per household.
– Institutional content licensing: $10–$60 per seat per year depending on depth, assessment, and reporting features.
– Custom content development: $5,000–$50,000+ for bespoke activity libraries and localization depending on scope.
Support and services
– Basic warranty: included 12 months.
– Extended warranty/onsite support: additional 5–15% of hardware cost per year.
– MDM licensing: $2–$10 per device per month depending on vendor and feature set.
Sample 3‑year TCO (per device, mid-tier tablet scenario)
– Hardware: $150 (one-time)
– Content license: $30/yr × 3 = $90
– MDM and support: $4/mo × 36 = $144
– Replacement/attrition reserve (20% over 3 years): $30
– Training and deployment per device (amortized): $15
– Total 3‑year TCO ≈ $429 → approx 2.9× initial hardware price
Cost per activity (useful metric for comparing static vs subscription models)
– Static device: if 100 activities and $50 unit cost → $0.50 per activity (no updates).
– Subscription model: $30/yr for evolving content; over 3 years = $90; if platform adds 300 activities across term, cost per activity = $0.30 but with ongoing dependency.
Negotiation levers for B2B buyers
– Volume discounts typically scale at tiers (500, 1,000, 5,000) — expect 5–25% discounts.
– Bundle negotiation: include 12–24 months of content licensing and MDM in hardware purchase.
– Payment terms: 30–60 days net; letter of credit for large international orders; negotiate refundable sample costs.
Capitalization vs operational budgets
– Decide whether to classify subscriptions as Opex and hardware as Capex; this affects procurement approval and lifecycle planning.
Competitive Landscape
Consumer brands
– VTech/LeapFrog/Fisher-Price: dominant in preloaded toy laptops and early literacy-focused devices. Strengths: curated content, safety reputation. Weaknesses: static content, limited expandability.
– Amazon Fire Kids Edition: tablet ecosystem with curated parental controls and content subscriptions (FreeTime Unlimited/Prime). Strengths: content library, price; Weaknesses: requires Amazon account, less classroom MDM support.
– Lenovo/Samsung/Acer kids variants: balance between consumer-grade hardware and school features.
Education-focused vendors
– Rugged Chromebook manufacturers (Acer, HP, Dell): strength in IT management, MDM, and access to web apps. Not optimized for preloaded activity count but provide access to large app ecosystems and LMS.
– Dedicated edtech platforms with hardware partnerships: provide curriculum-aligned libraries and teacher dashboards; typical procurement is hardware + multi-year content contracts.
OEM/ODM Landscape
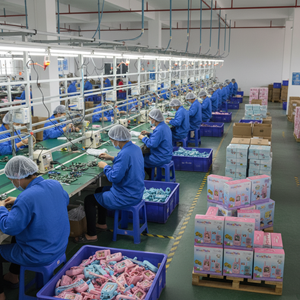
– Shenzhen and Guangdong manufacturers produce both toy laptops and tablets for private labels. Key OEM considerations: MOQ (500–2,000 units for custom branding), lead time (60–120 days), local certification support.
– White-label vendors often bundle content licensing with the hardware; verify ownership and rights for localization and distribution.
Regional dynamics
– North America: regulatory emphasis (COPPA, CPSIA) drives conservative choices and preference for established brands.
– Europe: GDPR‑K and EN71 compliance drives vendor selection.
– APAC/EMEA buyers often negotiate stronger localization and language packs.
Market consolidation and trends
– Increasing movement from static toy laptops to subscription and adaptive platforms.
– Vendors offering teacher dashboards and assessment reports win institutional deals.
– Competition centers on price per device, content quality, and post‑sale services (MDM, training, and spare parts).
What Buyers Say
Common positive feedback
– High engagement on well-designed activities: teachers report 10–20 minute sustained engagement per session when activities have progressive levels and audio reinforcement.
– Ease of use: simplified UIs and multi‑profile support reduce teacher setup time.
– Durability: rugged devices and sealed batteries reduce replacement frequency in classrooms.
Common complaints and risk signals
– Content stagnation: buyers report fatigue with static activity sets within 6–12 months when children use devices daily.
– Battery and charger failures: non‑standard chargers increase logistics and downtime.
– Inadequate reporting: basic devices without teacher dashboards create administrative burden for progress tracking.
– Hidden recurring costs: low‑cost hardware often paired with high subscription fees or in-app purchases.
– Poor localization and language options for non-English markets.
Procurement lessons from buyers
– Insist on a full activity list and an evaluation device before large orders.
– Pilot in the target setting (home vs classroom) and capture usage metrics.
– Validate support and replacement processes (RMA lead times, spare parts availability) in procurement contracts.
Safety, Maintenance and Compliance
Regulatory checklist
– Toy safety: CPSIA (U.S.), ASTM F963, EN71 (EU). Confirm third‑party lab test reports for physical hazards, small parts, and phthalates.
– Electrical safety: IEC 62368‑1 or equivalent depending on region.
– Battery safety: IEC 62133 certification for lithium batteries; UN38.3 for transport of Li‑ion packs.
– EMC/Radio: FCC Part 15 (U.S.), CE (EU) for wireless devices.
– Chemical compliance: RoHS, REACH where applicable.
– Data privacy: COPPA (U.S.), GDPR and GDPR‑K (EU), local child data protection laws. Request vendor privacy policy and DPA (Data Processing Agreement).
Physical safety and use guidelines
– Childproof battery compartments and tamper-resistant fasteners.
– Maximum surface temperatures under continuous use (vendors should document thermal testing).
– Non-toxic materials and washable surfaces; avoid solvents that degrade plastics or screen coatings.
Maintenance best practices
– Cleaning: recommended mild detergent or 70% isopropyl alcohol wipes for surfaces; follow vendor cleaning guide to avoid degrading touchscreens or coatings.
– Battery care: for Li‑ion devices, advise charging to 20–80% for storage; expect 300–500 full charge cycles before noticeable capacity loss.
– Spare parts inventory: maintain 5–10% spares for classroom fleets to minimize downtime.
– Firmware updates: schedule OTA updates during off‑hours; require vendor change logs and rollback capability.
– Disposal: follow local e-waste and battery recycling rules.
Compliance verification steps for buyers
– Request Certificate of Conformity (CoC) and lab reports for target jurisdictions.
– Include compliance clauses in procurement contracts specifying vendor responsibility for re-certification on hardware/firmware changes.
– For international orders, verify import regulations, tariffs, and battery transport documentation.
Frequently Asked Questions
How many activities do we need for a preschool program?
– Target 20–60 high-quality, multi-level activities focused on sensory, motor, language, and counting skills. Depth (levels) matters more than raw count.
Is a higher activity count always better?
– No. High counts with shallow or repetitive content do not increase learning. Evaluate depth, adaptivity, and curricular alignment.
Should we buy static or subscription content models?
– If you require offline operation and want predictable Opex, choose static or mixed models. For long-term scalability and varied grade coverage, subscription platforms are preferable if budgets and connectivity are available.
What is an acceptable lifecycle for a kids learning laptop in a classroom?
– Plan for 3 years as a minimum, with rugged devices and service plans extending to 4–5 years. Expect 10–30% annual attrition depending on handling.
How to measure if the activity count is delivering value?
– Pilot for 4–8 weeks and track: average session time, number of unique activities used per user/week, mastery rates on targeted skills, and teacher time spent managing devices.
How many simultaneous users should a device support?
– For personal devices target 1:1 profiles. For shared devices, ensure the local storage supports at least 5–10 profiles and that per‑profile progress can be exported or synced.
What are acceptable specs for assessment-heavy platforms?
– Quad‑core ARM CPU, 2–4 GB RAM, 16 GB storage, reliable Wi‑Fi, teacher dashboard with exportable reports. Ensure encrypted data transfer and compliance with child privacy laws.
What are minimum warranty and support terms to demand?
– For institutional purchases demand 12–24 months warranty, 48‑hour RMA response window for critical failures, and documented spare parts availability.
How to handle localization?
– Request proof of language packs and voiceover quality. Budget for human localization where accents and culturally appropriate content matter.
Contact Toyvao
For sample requests, volume pricing, device customization, or pilot support, contact Toyvao procurement:
– Email: sales@toyvao.com
– Website: https://www.toyvao.com (use the B2B procurement/contact form)
– Business hours (UTC−5): Mon–Fri 09:00–17:00 — include project brief, target age range, estimated annual volume, and required certifications when contacting.
Toyvao can supply product samples, technical spec sheets, compliance documentation, and pilot program templates upon request.