Selling electronic anime badges (wearable video/GIF badges) can be a highly profitable B2B opportunity when you control unit costs, choose the right SKU mix, and target the correct channels. This article gives importers, distributors, and brand owners a clear, numbers-driven roadmap to estimate gross and net profits, with practical pricing scenarios and sourcing tips from a Shenzhen OEM perspective.
Market context: Why electronic badges are a strong margin product
Wearable electronics are growing rapidly — the global wearable technology market is projected to reach $186 billion by 2030 (Statista). Toys and novelty wearables are a natural subsegment, supported by China’s robust toy export ecosystem (China Customs: over $38 billion annually). For buyers, that means reliable supply chains, mature manufacturing, and price competition that can protect margins when managed correctly.
Demand and buyer priorities
- Growing event, fandom, and promotional use — badges are popular for merch, corporate swag, and educational campaigns.
- Safety matters: 73% of parents prioritize “safe and non-toxic” as their top criterion when buying toys (NPD Group) — obtain CE/RoHS and toy-safety certificates to access family-focused channels.
- Higher perceived value for customizable content and better displays — brandable firmware and app integration increase wholesale price points.
Key cost drivers and margin levers
Profitability depends on controlling the following inputs. Each one is a lever you can use to improve margin.
1. Unit manufacturing cost (FOB)
- Basic badge (single-color LED/low-res screen): $3.00–$5.00 FOB at MOQ 1,000.
- Pro badge (full-color TFT, touch, higher battery): $6.00–$10.00 FOB at MOQ 1,000.
- Custom/OEM badge (certified, branded app, higher storage): $10.00–$18.00 FOB at MOQ 2,000+
Negotiation factors: MOQ, packaging, firmware customization, and certification scope.
2. Add-on costs
- Tooling and firmware development: one-time cost $1,500–$10,000 depending on complexity.
- Certifications (CE, RoHS, FCC, Toy safety): $1,000–$4,000 per SKU.
- Packing and labeling per unit: $0.10–$0.60.
- Shipping & duty (DDP or CIF): $0.30–$1.50 per unit depending on order size and destination.
Pricing strategies and profit examples
Below are three realistic scenarios that illustrate gross margin and approximate net profit per unit for different channels.
Scenario A — Wholesale to retailers (Volume-focused)
Assumptions: Pro badge FOB $8.50, shipping & duty $1.00, packing $0.30. Landed cost = $9.80. Wholesale price to distributor = $18.00 (84% markup over landed cost). Distributor sells to retail for $29.99.
- Gross margin (seller): ($18.00 – $9.80) / $18.00 = 45.6% ($8.20 gross profit per unit)
- Net profit after operating costs (marketing, returns, channel fees ~20%) ≈ $6.50/unit
Scenario B — Direct-to-retail (smaller volume, higher margin)
Assumptions: Pro badge FOB $8.50, landed $9.80, export pitch as white-label retail with direct purchase price $25.00 retail. Brand handles fulfillment (FBA/3PL) and marketing.
- Gross margin: ($25.00 – $9.80) / $25.00 = 60.8% ($15.20 gross)
- Net margin after fulfillment & ad spend (~30%) ≈ $10.64/unit
Assumptions: Unit FOB $14.00 with tooling amortized $5,000 across 5,000 units ($1.00/unit), landed cost ≈ $16.50. Custom content and packaging justify B2B price $35–$45.
- Selling at $40, gross margin = ($40 – $16.50) / $40 = 58.8% ($23.50 gross)
- Net margin after custom support (~25%) ≈ $17.63/unit
How to calculate your expected profit (step-by-step)
- Estimate FOB per unit based on SKU and MOQ.
- Add packing, shipping, duty to get landed cost per unit.
- Set your selling price by channel (wholesale, retail, B2B custom).
- Subtract landed cost from selling price to get gross profit per unit.
- Estimate operating costs (marketing, returns, warranty, storage) to compute net profit per unit.
- Calculate ROI for initial tooling and development amortized over expected volume.
Risk management and ways to protect margin
- Lock in material prices or sign multi-shipment contracts to avoid commodity swings.
- Bundle badges with content packages or accessories to increase AOV.
- Obtain toy-safety and electronics certifications to access higher-margin family channels (73% of parents prioritize safety).
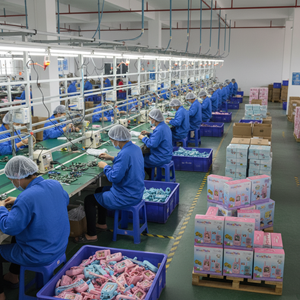
- Work with a reliable Shenzhen OEM to reduce defects and returns; China’s export infrastructure supports consistent supply (China Customs data).
Comparison of typical Electronic Badge SKUs
| SKU Tier | Typical FOB (USD) | Features | MOQ | Certifications | Typical B2B Price |
|---|---|---|---|---|---|
| Basic | $3.00–$5.00 | Mono-color, simple GIF support, no touch | 1,000 | RoHS | $8–$12 |
| Pro | $6.00–$10.00 | Full-color TFT, touch, larger battery, app upload | 1,000 | CE, RoHS, FCC optional | $18–$30 |
| Custom/OEM | $10.00–$18.00 | Branded UI, custom firmware, higher storage | 2,000+ | CE, RoHS, Toy Safety, FCC | $35–$60 |
Channels and expected velocity
Fast-moving consumer channels (retail, ecommerce marketplaces) will have higher returns but scale quickly. B2B channels (event merch, corporate gifting, distributors) deliver lower volume but higher per-unit margin and predictable reorders. Choose channel mix based on capacity to manage marketing and aftersales.
How much is the typical MOQ for electronic badges?
Typical MOQ ranges from 1,000 units for basic and pro SKUs to 2,000+ for custom OEM models where tooling and firmware development are involved.
What certifications are necessary to sell badges in the EU and US?
Common certifications include CE and RoHS for the EU, and FCC for the US. If marketed as a toy for children, toy-safety testing and related certificates are also required.
What is a realistic gross margin for distributors?
Distributors typically aim for 35–50% gross margin depending on SKU complexity, service-levels, and warranty provisions. Retail margins will differ based on channel fees and advertising.
How quickly can I recoup tooling and firmware costs?
Tooling amortization depends on order size; for example, a $5,000 tooling cost spread over 5,000 units adds $1.00/unit. At a $15 net profit per unit, tooling is recouped after roughly 334 units sold.
Is the wearable badge market growing enough to justify investment?
Yes. The broader wearable market is expanding rapidly — projected at $186 billion by 2030 (Statista) — and novelty/wearable niches continue to see demand from events, fandoms, and promotional buyers.
Ready to Source from Toyvao?
Contact us today for factory-direct pricing, OEM/ODM customization, and fast global shipping.
WhatsApp: +86 186 8106 4480
Email: sales@toyvao.com
Website: toyvao.com